A user's guide to Elodie archive data products
- ELODIE was decommissioned in mid-August 2006, after more than 12 years of observations.
- The ELODIE archive also incorporates spectra with signal-to-noise ratios between 3 and 10.
- As of 13 July 2009, the total number of spectra is 34992, of which 31299 are public.
- The number of distinct identifiers is 7476, of which 6173 are public.
- The total number of spectra with measured radial velocities is 25341.
|
About Elodie and the archive
Elodie is a cross-dispersed échelle spectrograph which saw first light at the OHP 1.93-m
on 1 June 1993. The instrument was open to visiting observers on 1 August 1994.
A publication
(HTML version) describes the main characteristics of the instrument, the on-line data
reduction pipeline and discusses its capabilities (see also the published paper:
Baranne et al. 1996 A&A Suppl.Ser. 119, 373). A
dedicated web
page presents the basic operation of the spectrograph at the telescope
and also the user's guide for the
on-line data reduction and the
input catalog.
All spectra taken with Elodie have been systematically copied to
DAT tapes (1993-1995) and later to CD-ROMs (October 1995 to present) but
general access to this data, after expiration of the proprietary period
of 2 years, has been cumbersome until now. The present archive aims
to improve this situation.
The Elodie archive
is a joint effort by Jihane Moultaka (Köln Univ. and LUTH, Paris Obs.),
Philippe Prugniel (CRAL, Lyon Obs.), Caroline Soubiran
(Bordeaux Obs.), Sergio Ilovaisky (OHP) and Mina Koleva (Sofia Univ.).
It now holds a large fraction of the spectra obtained with
the Elodie spectrograph, and will eventually contain all of it. As of
15 Jan 2006 the archive holds approximately 30600 spectra with signal-to-noise
greater than 10 in V (5500 Å), one-half of which are public.
Data with S/N < 10 (about 2700 spectra) will be made available later. The
original data are reprocessed on the fly upon each request, mainly to
correct for incomplete removal of the instrumental signature.
Even though users have no access
to the original raw data or to most results from the on-line reduction,
the present page gives the background information needed to better understand
and use the re-processed data retrieved from the archive.
Raw data
The original spectra cover the interval 3895-6815 Å in
67 orders.
One CCD pixel spans 0.04 Å in the blue end
and 0.07 Å in the red end of the spectrum.
With an average sampling per resolution element of 2.1 ±0.2
pixels, this yields a resolution of R=42000.
A special cross-disperser combining a prism and a
grism yields near constant inter-order spacing (see image below),
allowing the 67 orders to fit into a compact CCD 1024x1024 data format.
This is a unique characteristic of both Elodie and its sister spectrograph
Coralie
at ESO (La Silla) in Chile.
A typical échelle order is very narrow,
spanning at most 3 pixels perpendicular to the
dispersion. We show below three examples of raw CCD frames:
|
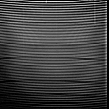 CCD frame for the spectrum of Altair obtained on 1998 July 02
in 120 seconds. The S/N ratio is 206 at 5500 Å.
The red end is at the top.
|
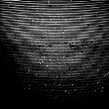 CCD frame for the 600-s spectrum of 51 Pegasi obtained on 29 October 1994
. The S/N ratio is 161. Notice the interleaved
Th-Ar comparison spectrum exposed simultaneously.
|
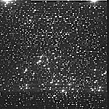 CCD frame for the spectrum of the Thorium wavelength calibration lamp.
The strongest lines are due to Argon impurities in the lamp.
|
There are two entrance apertures in the focal plane, each 2 arc-sec wide. One
is used for the star and the other for either the sky, for the tungsten
lamp or for the thorium lamp.
Image Types
The imatype keyword describes the focal plane configuration
used for the observations. The Elodie bonnette at the Cassegrain focus of
the 1.93-m telescope houses two different twin-optical fiber sets which are used
to transfer light to the spectrograph. One set called 'direct' uses simple
fibers and the other, called 'scrambled', includes optical scramblers in
the path for improved radial velocity stability. For each set, one fiber
is reserved for the object spectrum and the other for either the sky
spectrum or the Thorium spectrum, but it can be also be blocked.
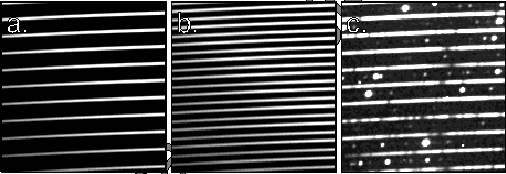
| |
Small part of the raw image for the three different types of
stellar exposure available. a "star fiber only", b star fiber and
sky fibre simultaneously illuminated (here by the tungsten lamp), c
"simultaneous thorium": star on the star hole and the sky hole
simultaneously illuminated by the thorium lamp.
|
The most frequent values for imatyp are:
OBJOd : object fiber only, direct fibers
OBJOs : object fiber only, scrambled fibers
OBJ2d : object fiber and sky in second fiber, direct fibers
OBJ2s : object fiber and sky in second fiber, scrambled fibers
OBTHd : object fiber and Thorium in second fiber, direct fibers
OBTHs : object fiber and Thorium in second fiber, scrambled fibers
Prior to 1997, only one set of fibers (the 'direct' set) was available,
and thus only OBJO, OBJ2 and OBTH are found. Users should note that for image
types OBTH, OBTHs and OBTHd the presence of the Thorium-Argon orders interleaved
with the stellar orders may lead to pollution of the stellar spectrum by highly
saturated Argon lines which can bleed into the adjacent stellar orders.
Reduced data
Standard calibration
at the beginning of the night included : bias, continuum lamp (tungsten lamp)
and thorium lamp frames. The continuum lamp frames have been automatically
analyzed to derive the location of the 67 orders and to extract both the
spectrum of the flat field and the blaze function. The thorium lamp images
have been automatically analyzed to derive the wavelength calibration, which is
expressed in terms of Tchebycheff polynomials.
The data reduction process which immediately followed data acquisition involved
subtraction of bias, dark or scattered light, optimal extraction of the
data along the orders (using Horne's algorithm), with cosmic-ray rejection,
division by the spectrum of the flat-field and by the blaze function (both
normalized to unity in each order), followed by
wavelength calibration.
The extracted orders were then grouped in a new image, called an s2d
image, containing 67 lines of 1024 pixels. This image retained the pixel
structure of the original spectrum along the dispersion
so that to each pixel corresponds a wavelength. Thus the original
(variable) sampling is preserved.
We show below samples of four different s2d images (in 67x1024 format)
(They have been zoomed in the vertical dimension
by a factor 10 for display purposes). Red is at the top and blue
at the bottom :

|
s2d image for the smoothed spectrum of the continuum
lamp after removal of the small-scale structure
(the spectrum of the flat field -see below-) by fitting a smooth spline
to each order.
|

|
s2d image for the spectrum of
the flat field derived, as explained above, from the
continuum lamp exposure. These are the residuals from the spline fit.
The features shown correspond to differences in sensitivity across the
CCD chip.
|

|
s2d image for the blaze function. It was derived
from the continuum lamp exposure (top image in this panel) by normalizing
each order to unity at maximum.
|

|
s2d image for the observation of the star
Altair shown in the previous panel.
The broad Hydrogen lines are clearly visible, particularly
Ha close to the top.
The narrow lines in the upper part of the
image are due to water vapor in the Earth's atmosphere.
|
The final step in the data reduction at the telescope was to rebin the
pixel spectra into equal wavelength steps. This resulted in 67 spectra in
FITS format for a single observation, called the s2dr spectra.
In an early version of the spectrograph software, a second-order flat-field
correction was applied, correcting for pixel-to-pixel changes
in sensitivity perpendicular to the dispersion,
which yielded the s2drff spectra. This option did not improve the
quality of the data for S/N ratios lower
than 300, and was not made available after the first five years.

|
An example of a single s2dr spectrum.
A plot for order 64 in the spectrum of Altair which
contains the broad Ha absorption line. The narrow
absorption lines are due to water vapor in the Earth's atmosphere, which are
masked in the data products delivered.
|

|
Several s2dr spectra of the Altair observation
are plotted together here, from 4500
to 6800 Å. Note the sawtooth-shape of the continuum, due to incomplete
removal the blaze function, which did not allow reconnection of the orders.
This effect has now been corrected for
in the spectra available through the archive, as explained below.
|
Archive data products
The incomplete removal of the blaze function responsible for the sawtooth-shape
of the continuum in the standard on-line reduction spectra
is due to the fact that in the original blaze
function all orders were normalized to unity at maximum. A procedure has been
implemented in the archive software which corrects for this effect.
It reconstructs an "improved
blaze function" from the old one by computing the ratio between the
smoothed spectrum of the continuum lamp and the old blaze function, order by
order, and multiplying the old blaze function by this ratio, again order by
order, and normalizing the resulting new s2d image to unity at order 41.
When the original s2d image is divided by this "improved blaze function",
the resulting instrumental intensity
distribution (related to collected electrons) is relative to the
continuum lamp (Teff~2700 K) and is thus "too blue" for the
actual spectrum of the star, but the sawtooth artifacts have disappeared.
An additional correction is made in the reconnected spectra
for the incomplete removal of diffuse light.
Users can retrieve FITS files (see the Tips
section for information) for the spectra of all stars listed in the
archive catalog which are not protected by special data rights (see also
the Tips section). These
reprocessed files are of two main types:
- spec: A single reconnected spectrum resampled in wavelength with
a constant step of 0.05 Å, covering the range 4000-6800 Å (the
first 3 blue orders are not included as the S/N ratio is usually very low).
It is available as (1) "instrumental flux" (units related to observed
quantities) and (2) normalized to the continuum, in a simple manner.
Other resampling options are available. The reconnected spectra are in the topocentric
reference frame ("as observed", not corrected for the Earth's motion in the line of sight).
- "new" s2d: A new image of 67 lines of 1024 pixels holding the extracted
spectra for all orders (covering the full spectral
range), corrected for the blaze problem (i.e. reconnectable),
where each pixel is assigned a wavelength (the coefficients are given in the
FITS header). The advantage of a spectrum in
the s2d format is that the original (variable) spectral
sampling is preserved across the entire wavelength interval, as no rebinning
has taken place, but special software is needed to use it. Please note that
these "new" s2d spectra are different from the "old" s2d spectra
customarily delivered to observers.
Shown below are samples of the spectra available in the archive,
again for the case of the star Altair. Please note that the telluric
lines (and any remaining CCD defects) have been masked. This is
most noticeable around the Sodium doublet and H-alpha, when
comparing with the previous plot:

|
The reconnected spectrum of Altair after correction
for the incomplete removal of the instrumental signature. The intensity
distribution is artificially too blue as explained above.
|

|
A version of the spectrum shown above
which has been normalized to the continuum. This
normalization is only approximate and thus not suitable for detailed spectral
analysis, such as equivalent width determinations.
|

|
"new" s2d image showing the spectrum of Altair after applying the
blaze correction described above. The instrumental intensity distribution
is now relative to that of the continuum lamp. Note that the telluric
lines which can be masked (as an option) in the resampled
and reconnected spectra are always present in the s2d spectra.
|
Radial Velocities
In December 2005 we released the on-line radial velocity results calculated at
the telescope. These were obtained from numerical cross-correlations with a spectral
mask file (made of 'holes' corresponding to more than 3000 selected weak
neutral metallic lines).
Two such masks are normally used, R37000F0 and R37000K0, for F0 and K0
spectral types, prepared for a slightly broadened spectral resolving
power of 37000. Other (private) masks are also used, in particular one useful
for A-type stars (prive4, with fewer lines) and another for M-type stars
(prive1). If available, the results are displayed through the "correlation"
button in the page with the query results. The CCF is also available as a FITS file.
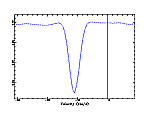
|
An example of a cross-correlation plot, downloaded from the database,
obtained for 51 Peg on 10 Jan 1995 using a K0 mask. The
S/N ratio is 127 in the V band, the barycentric radial velocity is -33.3 km/s,
the FWHM is 11.2 km/s and the depth is 17.6%
|
This numerical cross-correlation, an optional part of the on-line data
processing at the telescope, can yield very accurate radial velocities, even for low
S/N spectra, from a single gaussian fit to the cross-correlation profile
(or double fit in the case of spectroscopic binaries). Please note that not
all spectra have been processed in this manner. The velocities
derived are referred to the barycenter of the Solar System. In addition,
the 'sigma' of the gaussian and the depth of the profile are also given.
Note that the FWHM of the profile is given by 2.354 times 'sigma'. The CCF is computed
over a velocity interval selected by the user (normal, large, extra-large). The
normal step is 1 km/s over a ± 70 km/s interval centered on a value given by the
user.
If available, the accuracy of the radial velocity depends on several factors:
spectral type, the S/N ratio in the continuum, the rotational broadening of the lines
and the depth of the cross-correlation profile (contrast of the absorption lines).
The ultimate accuracy is
obtained when using the simultaneous Thorium exposure mode and the scrambled fibers,
in which case it can reach ± 7 km/s. A set of
radial-velocity standard stars
have been measured regularly to monitor the stability of the system.
When doing a cross-correlation on objects observed with the sky in the
second fiber (imatyp OBJ2), presumably in a moonlit sky, the profile has been
corrected for the effects of the sky contamination, as derived from a
prior cross-correlation on the sky spectrum.
As of 1 Jan 2006, there are approximately 22950 spectra with a radial velocity
measurement, of which 9040 are public and 3700 of these have distinct
identifiers. Approximately 13900 spectra are still under embargo, with 2220
distinct identifiers. 7540 spectra have no radial velocity measurement.
It should be mentioned here that the cross-correlation function
can also yield information on temperature and metallicity (from the surface
under the curve) and rotational velocity (from its width). See
Queloz et al.(1998)
and
Santos et al.(2002)
for more information.
Reprocessing of ELODIE spectra using software developped for the
HARPS spectrograph has been undertaken
by the Geneva group. This should correct for small effects in
the radial velocities due to changes introduced in the subsequent
versions of the extraction
and cross-correlation software used at the telescope.
Quick tutorial
Suppose that you are interested, for example, in the spectrum of star 51 Peg.
The first step then is to look in the archive to see if
the star has been observed with Elodie. Since you ignore its HD number,
you just type the name 51 Peg in the box right under the banner
"Enter an identifier..." and click on the Submit button right below.
Please note that more options are now available for object selection. After
a few moments a new page appears with the results:
The name 51 Peg is not recognized in ELODIE archive
but its position J225728.0+204608 was found in Simbad.
We found 145 spectra of objects within one arcmin from this position.
15 of them are public.
They are listed below.
HD217014
J225726.8+204603 S 19971015/0014
[spectrum] [header] [spec] [s2d] [customize]
(...more lines deleted here...)
Let's see what all this means. We first learn that the name 51 Peg is not
already indexed in the archive as a star name, so that
we had to ask Simbad for
the coordinates of that star. Next we see that in the archive there are
120 spectra of objects lying within one arc-min of this position. Presumably
they are all of 51 Peg! Finally, we see that 11 of these spectra are public,
so we conclude that the rest have been taken by observers who requested that
their data be protected.
On the next lines we see that the star is called HD217014
(the hyperlink gets you
back to the main archive page) and what its 2000 coordinates are (don't
worry that they don't match exactly those listed above). The S
link opens a new navigator window with the Simbad page for that
object.
Next we see that this spectrum was taken on 15 October 1997 and
that it was the 14th spectrum taken on that night.
Clicking on any one of the
buttons to the right allow you to explore the spectrum further.
- The spectrum button shows you a small plot of the actual data, in
the interval 4000-6800 Å,
- The header button lists the FITS file header of the s2d file
with plenty of useful technical information about that observation,
such as observer name, exposure time, signal-to-noise ratio, etc.
- The spec button lets you download a FITS file
(you may have to give it a meaningful name --see Tips)
with the reconnected spectrum in "instrumental flux" (i.e. divided by the
smoothed spectrum of the tungsten calibration lamp), rebinned using a constant
0.05 Å step and covering the interval 4000-6800 Å.
- The s2d button lets you download a FITS file
(you may have to give it a meaningful name --see Tips)
with a 67x1024 image containing the fully reduced extracted orders
(non-rebinned, non-reconnected), which preserves the original (variable)
spectral sampling. The wavelength dispersion coefficients are given
in the header. A more user-friendly format will be made available in the
next version of the archive software.
- The customize button displays a new page where you can specify
in more detail how you want your data (but see the
warning below). In particular, in the "Pipeline
processing" section, you can plot and request the spectrum with
the continuum normalized to unity.
To see this continuum-normalized spectrum, do as follows:
- Select whether or not telluric lines are to be masked
- Select the Continuum normalized flux option
in the drop-down menu called "Flux Calibration".
- THEN click the Flux Calibration button.
- Click the Display spectrum button
- Finally, click the Submit button in the bottom panel
To download this continuum-normalized spectrum, do as follows:
- Select whether or not telluric lines are to be masked
- Select Continuum normalized flux
in the drop-down menu called "Flux Calibration".
- THEN click the Flux Calibration button.
- Select the Download to a FITS file in the "Output option"
section
- Finally, click the Submit button in the bottom panel
Useful tips
Object designations
The archive now contains more than 30000 spectra (half of them are public),
for 6600 distinct object designations. Since at the present time most
designations are those originally given by the observer,
a given object may still appear under several different aliases (e.g.
HD 116656 and HIP 65378). A cross-identification
effort to remove these aliases is presently underway.
You should also be aware that, in spite of our efforts,
incorrect object identifiers and/or catalogue
coordinates (as well as poor telescope coordinates) are still present in
the archive, thereby leading to query results that may puzzle you.
We will try to remedy this situation as soon as possible.
Downloading FITS files
The downloading of FITS files from the archive has now been improved.
With very few exceptions,
most recent browsers (including Netscape, Mozilla and Internet Explorer)
will now display a dialog box prompting you to save the
downloaded file with the generic name file.fits.
Please change it to reflect the
star's actual name and/or spectrum number.
More advanced ways to
access the archive
FITS file formats
The
FITS format used in the resampled and reconnected
spectra obtained from the archive has three
extensions.
The FITS format files for the s2d spectra have two extensions.
Please make sure that the software you use to read the files
handles these extensions.
(See the help files for MIDAS and
IRAF). Within MIDAS it is suggested to
convert the FITS file into a table file (use COPY/IT) for easier handling.
See also the on-line help file for the "Download"
function in the archive.
Telluric lines, CCD defects and NaNs
Parts of the spectra containing telluric absorption lines or
uncorrected CCD defects can be masked and
replaced by IEEE undefined values, or
NaN
(Not-a-Number). Note that masking is
now de-selected as the default. Be aware that some old FITS readers
may not handle them intelligently and that you may have to replace them
by regular values, for example zeros.
WARNING: at the
present time any rebinning and/or extraction done in the "customize" page
will result in an undesirable interpolation over the zones containing NaNs.
This is not normally a problem when downsampling to a lower resolution
(say R<4000), but doing so with a step close to the original sampling
(0.05 Å) will result in artificial data in zones where telluric lines and/or
uncorrected CCD defects are present.
Please do all zooming in the "view spectrum" page.
There is an option available in the "customize" page to mask/unmask any telluric lines in
the spectrum before visualization or downloading.
Radial velocities
Elodie is a spectrograph specially designed for very accurate (± 7 m/s)
measurements of stellar radial velocities, when used in scrambled fiber
mode and with a simultaneous Thorium exposure in the second (sky) channel.
The results for the radial velocities of the stars in the archive are now
available. The spectra available through the archive are in the topocentric reference
frame, i.e. "as observed". They have not been corrected for the radial velocity of the
star nor for the Earth's velocity around the Sun as projected in the line
of sight to the star (the barycentric correction). These corrections will be
made available in the future.
Upcoming features: How to retrieve spectra of stars with
specific characteristics
Data rights
Data taken with OHP instrumentation are the property of Observatoire
de Haute-Provence (CNRS). Observers are currently granted exclusive rights to their
data for two years, after which time they become available to the astronomical
community. Some observers who are engaged in log-term projects (i.e.
search for
extrasolar planets) have requested that their data be protected for a
longer period. Their data are thus presently "embargoed", but will eventually
will be available.
|