[ Other OHP preprints |
OHP home page ]
Spatial distribution
of unidentified infrared bands and
Extended Red Emission in the compact galactic H II region Sh 152
![[*]](foot_motif.gif)
S. Darbon1, A. Zavagno2, C. Savine1, V. Ducci2,
J.-M. Perrin1, J.-P. Sivan1
1Observatoire de Haute Provence du CNRS, 04870 Saint-Michel l'Observatoire,
France.
2Observatoire de Marseille, 2 Place Le Verrier, 13248 Marseille Cedex 4,
France.
To be published in the proceedings of the colloquium "The Universe as seen
by ISO"
held in Paris, October 20-23, 1998
Abstract:
We present visible and near IR images of the compact HII region Sh 152.
Some of these images reveal the presence of Extended Red Emission (ERE) around
698 nm and emission from Unidentified Infra Red Bands (UIRBs) at 3.3 and
6.2µm. Other images show the near infrared (7-12µm) continuous
emission of the nebula. The ERE emission is found to coincide with the ionized
region and significantly differ from the UIRBs location. Also some evidence
is found in favor of grains as carriers for ERE.
Key words: HII regions, ERE, UIRBs
Extended red emission (ERE) is a continuous emission band observed in the
red part (600-800 nm) of the spectrum of various astrophysical objects
like reflection nebulae ([Schmidt, Cohen & Margon1980], [Witt & Boroson1990]), planetary nebulae
([Furton & Witt1992]), HII regions ([Sivan & Perrin1993], [Darbon, Perrin & Sivan1998]), high-latitude
galactic cirrus clouds ([Szomoru & Guhathakurta1998]), the halo of the galaxy M82 ([Perrin, Darbon & Sivan1995])
and also in the diffuse galactic interstellar medium ([Gordon, Witt & Friedmann1998]). This
emission can be attributed either to Hydrogenated Amorphous Carbon (HAC)
grains ([Watanabe, Hasegawa & Kurata1982], [Furton & Witt1993]) or silicon grains ([Witt, Gordon & Furton1998],
[Ledoux et al.1998]).
A series of emission bands in the 3-16µm range, the so-called
UIRBs, is also observed in dusty environments and commonly attributed
to Polycyclic Aromatic Molecules (PAH)([Puget & Léger1989], [Allamandola, Tielens & Barker1989]) and/or
carbonaceous materials ([Papoular et al.1989]).
In particular, the existence (or absence) of a spatial correlation
between IURBs and ERE might be useful to put constrains on the nature of the
carriers. Compact HII regions are bright and dusty objects well
suited for this kind of study.
This is the reason why we have carried out an observational program for imaging
compact HII regions at visible and infrared wavelengths in order to
detect and to map respectively ERE and UIRBs. This paper reports on the results
obtained for Sh 152.
Infrared images of Sh 152 were obtained with ISOCAM in june 1997, during
ISO revolution 563. These include UIRBs images at 3.3
and 6.2µm and
four continuum images taken with the ISOCAM circular variable filter (CVF) at
6.911, 8.222, 10.52 and 12.00µm.
These observations and data reduction
are described in [Zavagno & Ducci1998]. In particular, the 3.3 and
6.2µm images presented in this paper were corrected for the adjacent
continuum emission.
Visible images in
the 500-850 nm range were obtained, in october 1997, with a 1024x1024
thinned back-illuminated Tektronix CCD camera mounted at the Newton focus
of the 120 cm telescope of the Observatoire de Haute Provence.
Four interference filters with a FWHM  10 nm centered on 528.2,
612.0, 697.5 and 812.5 nm were used. These filters were chosen to
isolate the continuum emission of Sh 152 and to avoid nebular and night sky
emission lines.
For each continuum filter, twenty-five 15 min exposure time frames were
obtained and co-added, yielding a resulting image of six hours exposure time.
Standard data reduction was performed using ESO-MIDAS software. It includes :
dark current subtraction, flat fielding, airmass and interstellar extinction
corrections, deconvolution by point spread function. According to spectroscopic
observations of ERE in HII regions ([Sivan & Perrin1993]), the emission excess
in the 697.5 and/or 812.5 nm filters should be attributed to ERE. Actually the
best contrasted results were obtained by making the difference between the
697.5 and 612.0 nm images. The resulting image was considered as giving the
spatial distribution of ERE over Sh 152.
10 nm centered on 528.2,
612.0, 697.5 and 812.5 nm were used. These filters were chosen to
isolate the continuum emission of Sh 152 and to avoid nebular and night sky
emission lines.
For each continuum filter, twenty-five 15 min exposure time frames were
obtained and co-added, yielding a resulting image of six hours exposure time.
Standard data reduction was performed using ESO-MIDAS software. It includes :
dark current subtraction, flat fielding, airmass and interstellar extinction
corrections, deconvolution by point spread function. According to spectroscopic
observations of ERE in HII regions ([Sivan & Perrin1993]), the emission excess
in the 697.5 and/or 812.5 nm filters should be attributed to ERE. Actually the
best contrasted results were obtained by making the difference between the
697.5 and 612.0 nm images. The resulting image was considered as giving the
spatial distribution of ERE over Sh 152.
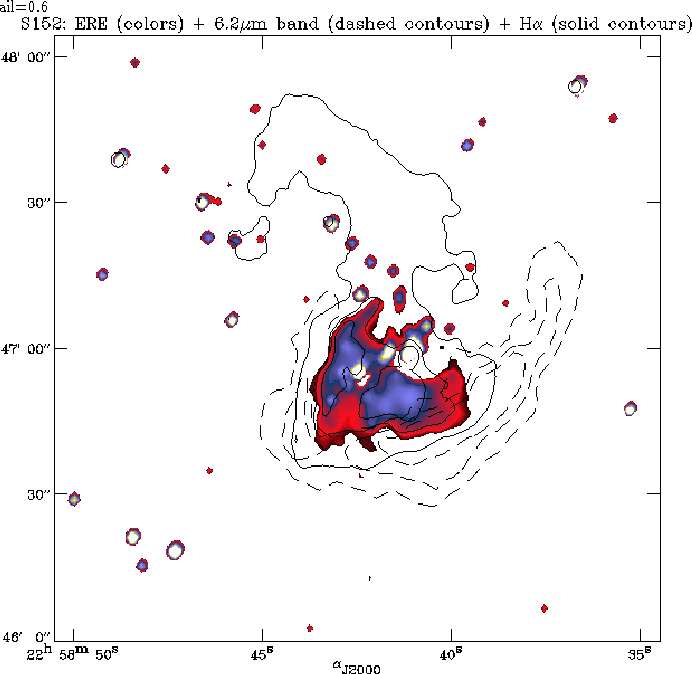
Figure:
6.2µm (colors), 3.3µm emission bands (dashed
contours) and H emission (solid contours) in Sh 152 emission (solid contours) in Sh 152
 |
|
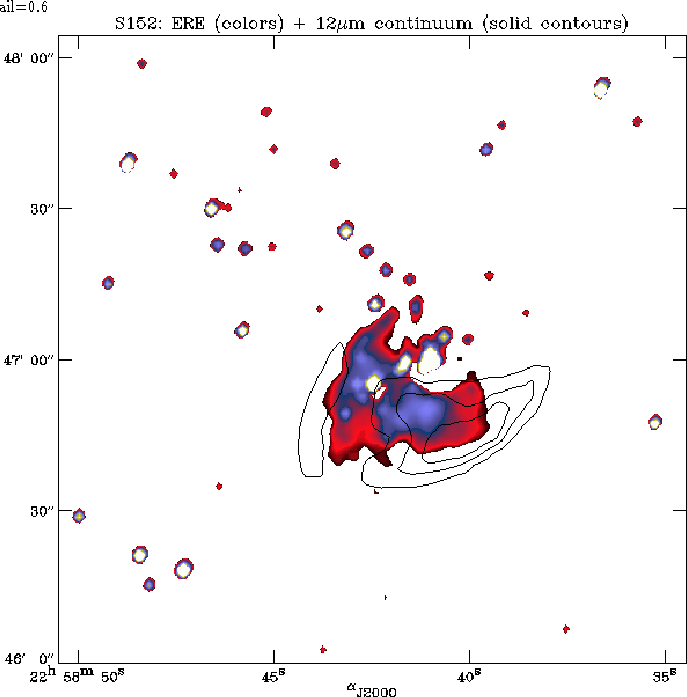
Figure:
ERE distribution (colors), 6.2µm emission band (dashed
contours) and H emission (solid contours) in Sh 152
 |
|
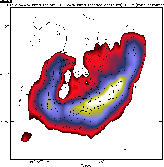
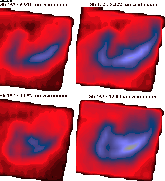
Figure:
ERE distribution (colors) in Sh 152 and 12µm continuum
image (solid contours)
 |
|
Figure:
Continuum emission in Sh 152 observed with the ISOCAM CVF at
6.911, 8.222, 10.52 and 12.00µm
 |
|
The 3.3µm, 6.2µm and H
images of Sh 152 are displayed in
Figure
![[*]](cross_ref_motif.gif)
.
It can be seen that the 3.3 and 6.2µm emission
bands have the same spatial distribution over the entire nebula. This suggests
their carriers could be the same. Also, it appears from Figure
that the infrared emissions arise from regions located outside the ionized
regions (traced by H
emission).
Figure presents the spatial distribution of ERE superimposed on
the 6.2µm band image and the H image.
ERE is found to coincide with the H emission but significantly differs
from that of the 6.2µm emission band. Hydrogen environment and UV
radiation are well suited to induce luminescence from HAC grains ([Furton & Witt1993]).
Figure presents the spatial distribution of ERE
superimposed on a 12µm continuum image. It can be seen that the
12µm emission extends over the area where the ERE intensity reaches its
maximum. This coincidence is in favor of grains as carriers of the ERE
because (i) the 12µm emission is thought to be the short wavelength part
of a strong thermal emission from cold grains (see, for example, IR spectra of
ultra compact
galactic HII regions presented by [Roelfsema et al.1998])and (ii) because such
cold grains can exist in Sh 152 at the distance from the
exciting star where the observed coincidence occurs.
In effect, according to [Lamy & Perrin1997], the temperature of a dust solid particle located at a
distance 104 R* = 2.102 AU = 10-3 pc from an O9.5 V star of
radius R AU, would be of 200K for a silicate grain or
400K for a carbonaceous grain. The region in Sh 152 where ERE maximum and
12µm emission coincide is in fact much
farther from the star (about 0.2 pc, assuming a distance of 3.5 kpc for
Sh 152 ([Heydari-Malayeri & Testor1981])) than in the calculations so that, although
the exciting star of Sh 152 is slightly hotter than an O9.5V star
([Hunter & Massey1990]), we can assume that cold grains do exist in the area.
Figure presents the four continuum images of Sh 152 at 6.911,
8.222, 10.52 and 12.00µm taken with ISOCAM. In these images, the flux
is normalized to the maximum observed in the LW6 filter, centered at
7.7µm. At the location of the ERE maximum, the infrared images show flux
values increasing with wavelength : this is in agreement with thermal emission
from cold grains (note that the 10.52µm flux might be contaminated by the
[SIV] 10.54µm emission line).
Visible and infrared images of Sh 152 allowed us to compare the spatial
distribution of ERE and UIRBs and to deduce basic physical properties. We
found that :
- the spatial distribution of the two UIRBs at 3.3 and 6.2µm are the
same, suggesting similar properties for their carriers
- the UIRBs emission peak is located at the border of the ionized region
- the ERE emission coincides with the ionized region and significantly
differs from the UIRBs location.
- the continuum emission observed between 10.5 and 12µm is
coincident with ERE emission and possibly due to cold grains, which is in
favor of grains as carriers of the ERE.
Nevertheless, the exact nature of the ERE carriers will only be constrained
using spectroscopic data and comparing the ERE band shape with laboratory
experimental data (Darbon et al., in preparation)
- Allamandola, Tielens & Barker1989
-
Allamandolla, L.J., Tielens, A.G.G.M., Barker, J.R., 1989, ApJS 71, 733
- Darbon, Perrin & Sivan1998
-
Darbon, S., Perrin, J.-M., Sivan, J.-P., 1998, A&A 333, 264
- Furton & Witt1993
-
Furton, D.G., Witt, A.N., 1993, ApJ 415, L51
- Furton & Witt1992
-
Furton, D.G., Witt, A.N., 1992, ApJ 386, 587
- Gordon, Witt & Friedmann1998
-
Gordon, K.D., Witt, A.N., Friedmann, B.C., 1998, ApJ 498, 522
- Heydari-Malayeri & Testor1981
-
Heydari-Malayeri, M., Testor, G., 1981, A&A 96, 229
- Hunter & Massey1990
-
Hunter, D.A., Massey, P., 1990, AJ 99, 846
- Lamy & Perrin1997
-
Lamy, P.L., Perrin, J.-M., 1997, A&A 327, 1147
- Ledoux et al.1998
-
Ledoux, G., Ehbrecht, M., Guillois, O., Huisken, F., Kohn, B., Laguna, M.A.,
Nenner, I., Paillard, V., Papoular, R., Porterat, D., Reynaud, C., 1998, A&A
333, L39
- Papoular et al.1989
-
Papoular, R., Conard, J., Giuliano, M., Kister, J., Mille, M., 1995,
A&A 217, 204
- Perrin, Darbon & Sivan1995
-
Perrin, J.-M., Darbon, S., Sivan, J.-P., 1995, A&A 304, L21
- Puget & Léger1989
-
Puget, J.-L., Léger, A., 1989, ARA&A 27, 161
- Roelfsema et al.1998
-
Roelfsema, P.R., Cox, P., Kessler, M.F., Baluteau, J.-P., 1998, in:
Star Formation With The Infrared Space Observatory (ISO),
eds. Yun, J.L., Liseau, R. (Lisbon: ASP Conf. Ser., 132), 76
- Schmidt, Cohen & Margon1980
-
Schmidt, G.D., Cohen, M., Margon, B., 1980, ApJ 239, L133
- Sivan & Perrin1993
-
Sivan, J.-P., Perrin, J.-M., 1993, ApJ 404, 258
- Szomoru & Guhathakurta1998
-
Szomoru, A., Guhathakurta, P., 1998, ApJ 494, L93
- Watanabe, Hasegawa & Kurata1982
-
Watanabe, J., Hasegawa, S., Kurata, Y., 1982, Japanese Journal of Applied
Physics 21, 856
- Witt & Boroson1990
-
Witt, A.N., Boroson, T.A., 1990, ApJ 355, 182
- Witt, Gordon & Furton1998
-
Witt, A.N., Gordon, K.D., Furton, D.G., 1998, ApJ 501, L111
- Zavagno & Ducci1998
-
Zavagno, A., Ducci, V., 1998, this conference
SPATIAL DISTRIBUTION OF UNIDENTIFIED INFRARED BANDS AND
EXTENDED RED EMISSION IN THE COMPACT GALACTIC HII REGION SH 152
This document was generated using the
LaTeX2HTML translator Version 97.1 (release) (July 13th, 1997)
Copyright © 1993, 1994, 1995, 1996, 1997,
Nikos Drakos,
Computer Based Learning Unit, University of Leeds.
The command line arguments were:
latex2html -local_icons -split +0 pp132.tex.
The translation was initiated by on 12/16/1998
Footnotes
-
- ISO is an ESA
project with instruments funded by ESA Member States (especially the PI
countries: France, Germany, the Netherlands and the United Kingdom) and
with the participation of ISAS and NASA.
-
- Partly based on observations made at Observatoire de Haute Provence du
CNRS
12/16/1998