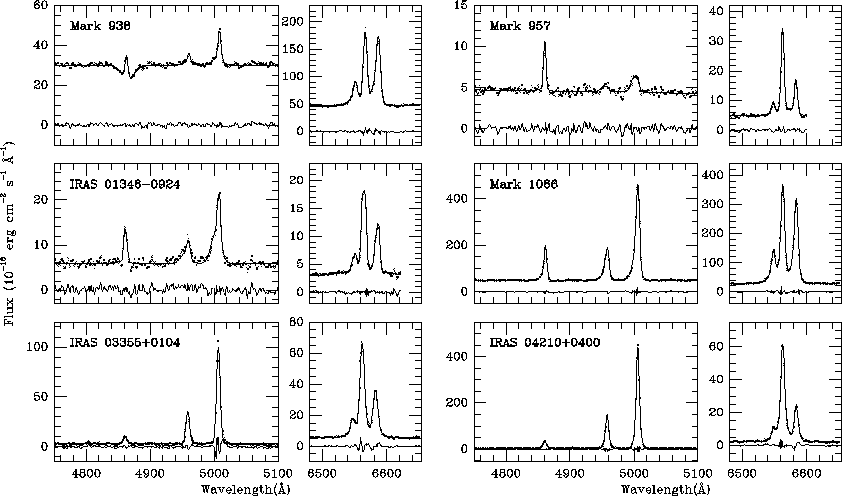
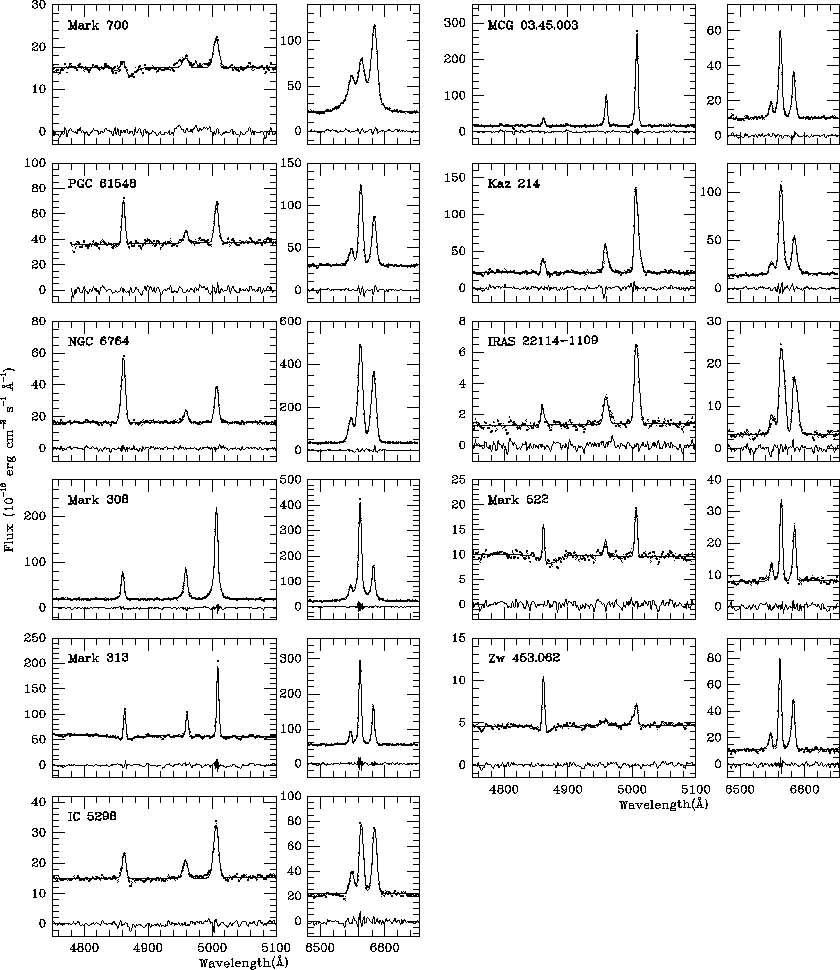
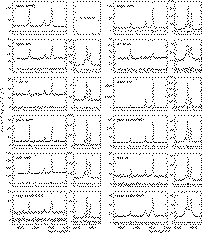
Figure 1:
Blue and red spectra for the 53 galaxies studied in this paper.
For 52 of the observed AGNs we present 66 Åmm-1 spectra; in the case of
VII Zw 73, we give 33 Åmm-1 spectra. For 4 of the observed objects, only
one spectral region is available. All the spectra were de-redshifted to
rest wavelengths. The spectral ranges displayed are
 4750-5120 Å and 6480-6650 Å. In
each frame the data points (small crosses), the best fit (solid line) and
the residuals (lower solid line) are shown. For the red spectrum of
SBS 1136+594, the individual components of the fit are also given as
an example (dotted lines). 4750-5120 Å and 6480-6650 Å. In
each frame the data points (small crosses), the best fit (solid line) and
the residuals (lower solid line) are shown. For the red spectrum of
SBS 1136+594, the individual components of the fit are also given as
an example (dotted lines).
|
|
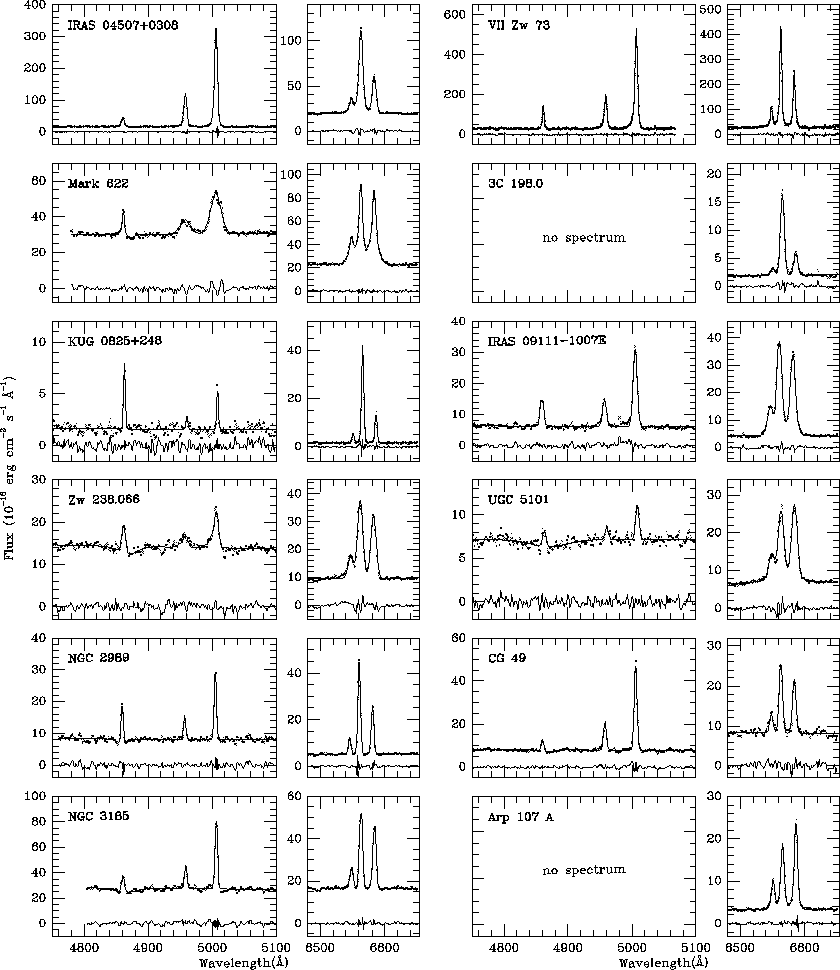
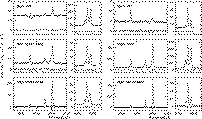
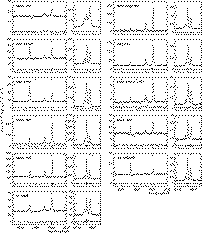
Figure 1:
Blue and red spectra for the 53 galaxies studied in this paper
(continued).
 |
|
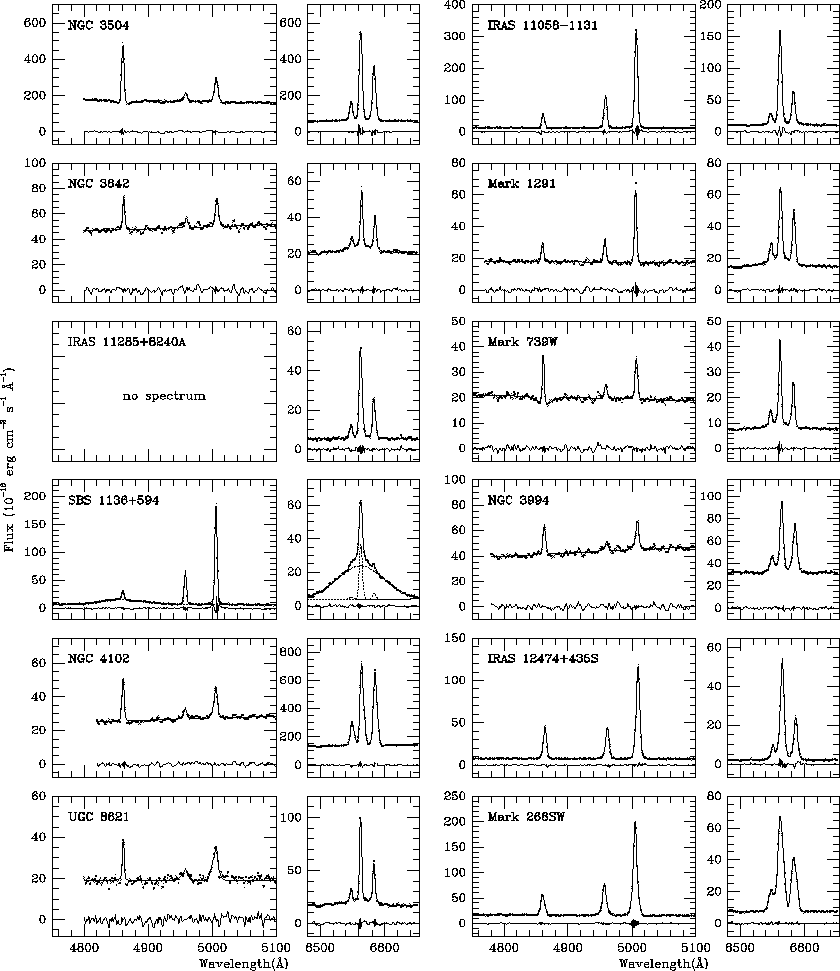
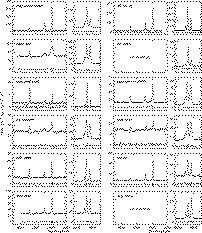
Figure 1:
Blue and red spectra for the 53 galaxies studied in this paper
(continued).
 |
|
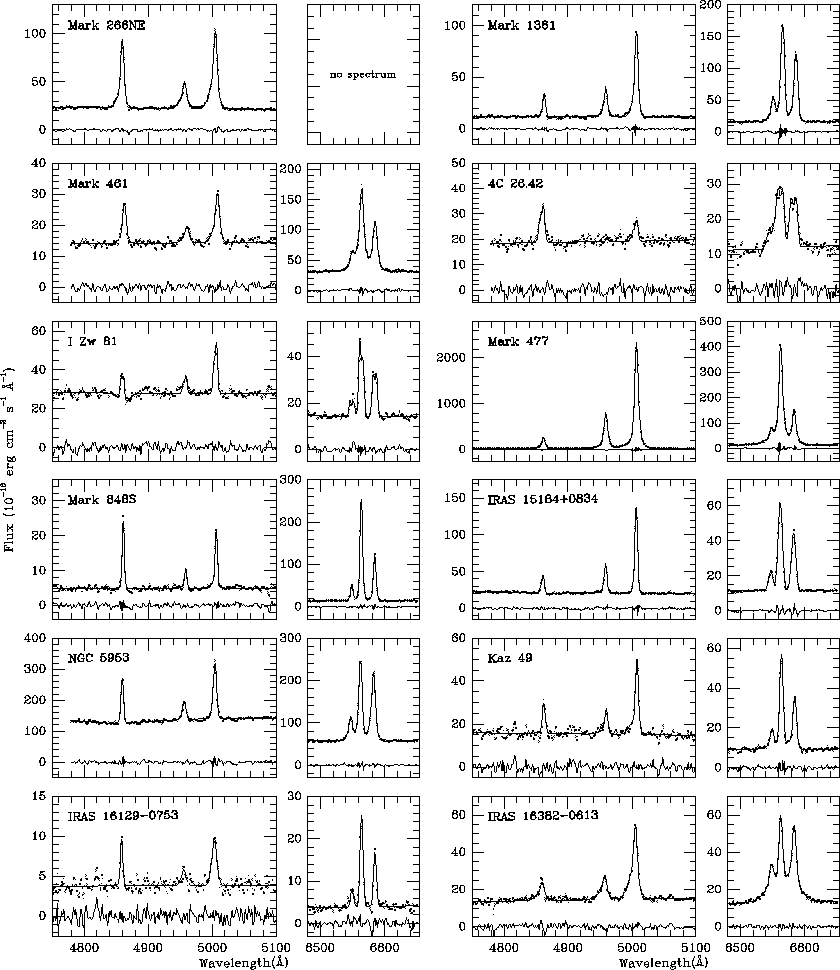
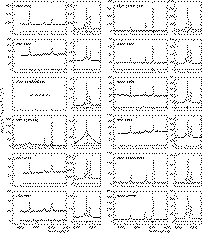
Figure 1:
Blue and red spectra for the 53 galaxies studied in this paper
(continued).
 |
|
Figure 1:
Blue and red spectra for the 53 galaxies studied in this paper (end).
 |
|