 |  |
 |  |
 |  |
 |  |
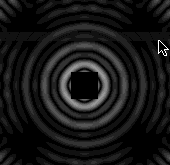
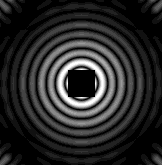
Figure 7: Coronagraphy with an EED having 36 circular apertures arrayed along a circle. The simulated star image is shown with a phase mask (left) and without (right). The ccntral black square is a software mask added in the display for better visibility of the faint feet, and identical intensity scales (steps of 10 in the calibration marks at bottom left) are used in both images, with 0.5 contrast for better visibility. A faint horizontal band, 2,000 times fainter than the star's peak intensity obtained at right with the software mask removed, is added to both images. It is barely detectable at left (arrow) but invisible at right. A planet with 10-6 relative level in the infra-red would be similarly detectable as a faint peak, with additional cleaning techniques such as dark hole apodization and dark speckle analysis. The imaging field is here wider than with the hexagonal arrangement of figures 6, but the image is fainter, with equal collecting areas, since the pupil is not so dense.