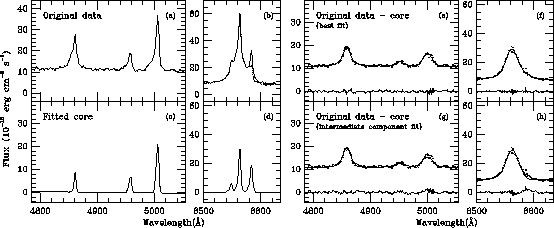
The spectra were de-redshifted assuming z = 0.0434 and analyzed in terms
of Gaussian components as described above. We discovered first that the core
of the lines could not be fitted by a single set of narrow Gaussian profiles.
To get a satisfactory fit, two sets of Gaussian components are needed: the
first, unresolved (and subsequently taken as the origin of the velocity
scales) has ![]() 6583/H
6583/H![]() = 0.55,
= 0.55,
![]() 5007/H
5007/H![]() = 1.27, and corresponds to a HII region; the second
is resolved (FWHM
= 1.27, and corresponds to a HII region; the second
is resolved (FWHM ![]() 350 kms-1, corrected for the instrumental
broadening), blueshifted by
350 kms-1, corrected for the instrumental
broadening), blueshifted by ![]() 95 kms-1 with respect to the
narrow components and has line intensity ratios typical of a Seyfert 2
(
95 kms-1 with respect to the
narrow components and has line intensity ratios typical of a Seyfert 2
(![]() 6583/H
6583/H![]() = 0.84,
= 0.84, ![]() 5007/H
5007/H![]() > 10).
> 10).
|
At this stage, we removed from the blue and red spectra the best fitting core
(the HII region and the Seyfert 2 nebulosity, Fig. 1c and d), obtaining two
spectra we shall call ``original data - core''. The blue one was then fitted
with a broad H![]() Gaussian component and two sets of three components
modeling the narrow H
Gaussian component and two sets of three components
modeling the narrow H![]() and [OIII] lines. The
result is very suggestive: one set has a strong H
and [OIII] lines. The
result is very suggestive: one set has a strong H![]() line and very weak
negative [OIII] components, while
the other set displays a strong [OIII]
contribution and a weak negative H
line and very weak
negative [OIII] components, while
the other set displays a strong [OIII]
contribution and a weak negative H![]() component, showing that we have
in fact a H
component, showing that we have
in fact a H![]() component with no
associated [OIII] emission and [OIII]
lines with a very weak (undetected) associated H
component with no
associated [OIII] emission and [OIII]
lines with a very weak (undetected) associated H![]() ; in other words, the
region producing the H
; in other words, the
region producing the H![]() line does not emit forbidden lines, while the
[OIII] emitting region has a high
line does not emit forbidden lines, while the
[OIII] emitting region has a high ![]() 5007/H
5007/H![]() ratio, which are
the characteristics of the ``broad'' and ``narrow'' line regions in Seyfert 1
galaxies, respectively.
ratio, which are
the characteristics of the ``broad'' and ``narrow'' line regions in Seyfert 1
galaxies, respectively.
With these results in mind, we optimized this last fit by using a Lorentzian
profile for the H![]() line, with no associated [OIII] emission, and a set
of three Gaussians for the remaining contribution coming from the ``narrow''
components; to avoid an unphysical negative intensity for the H
line, with no associated [OIII] emission, and a set
of three Gaussians for the remaining contribution coming from the ``narrow''
components; to avoid an unphysical negative intensity for the H![]() line,
we forced
line,
we forced ![]() 5007/H
5007/H![]() to be equal to 10, which is the ratio
usually found for the narrow component in Seyfert galaxies. The best fit is
presented in Fig. 1e. The H
to be equal to 10, which is the ratio
usually found for the narrow component in Seyfert galaxies. The best fit is
presented in Fig. 1e. The H![]() Lorentzian component is blueshifted by
160 kms-1 with a width of 920 kms-1; the [OIII] lines are
blueshifted by
Lorentzian component is blueshifted by
160 kms-1 with a width of 920 kms-1; the [OIII] lines are
blueshifted by ![]() 395 kms-1 and their width is
395 kms-1 and their width is ![]() 1120
kms-1.
1120
kms-1.
We have also analyzed the ``original data - core'' red spectrum (Fig. 1f)
with one Lorentzian H![]() component and a set of three Gaussians (for the
H
component and a set of three Gaussians (for the
H![]() and [NII] lines) with the constraint that
and [NII] lines) with the constraint that
![]() 6583/H
6583/H![]() = 0.9, for which we have found a FWHM of
= 0.9, for which we have found a FWHM of ![]() 770 kms-1 and a blueshift of 375 kms-1. The H
770 kms-1 and a blueshift of 375 kms-1. The H![]() Lorentzian
component, blueshifted by 55 kms-1, has a width of 1030
kms-1, in reasonable agreement with the width of the corresponding
H
Lorentzian
component, blueshifted by 55 kms-1, has a width of 1030
kms-1, in reasonable agreement with the width of the corresponding
H![]() component. The Lorentzian Balmer components, without any measurable
associated forbidden line, would qualify KUG 1031+398 as a NLS1 with, in fact,
very narrow lines. The other system of lines, with a very high
component. The Lorentzian Balmer components, without any measurable
associated forbidden line, would qualify KUG 1031+398 as a NLS1 with, in fact,
very narrow lines. The other system of lines, with a very high
![]() 5007/H
5007/H![]() ratio,
ratio, ![]() 6583/H
6583/H![]()
![]() 0.9 and
FWHM
0.9 and
FWHM ![]() 945 kms-1, is analogous to what is usually found in
Seyfert 2s and corresponds to a NLR cloud.
945 kms-1, is analogous to what is usually found in
Seyfert 2s and corresponds to a NLR cloud.
At last, we fitted the ``original data - core'' blue spectrum with a
broad H![]() Gaussian component and one set of three Gaussians (modeling
H
Gaussian component and one set of three Gaussians (modeling
H![]() and the [OIII] lines) for which we set the
and the [OIII] lines) for which we set the ![]() 5007/H
5007/H![]() ratio to the value found by Mason et al. for the ``intermediate'' component,
i.e., 1.42. The red spectrum was fitted with two H
ratio to the value found by Mason et al. for the ``intermediate'' component,
i.e., 1.42. The red spectrum was fitted with two H![]() components, for
which we fixed the redshifts to the values obtained in the blue spectrum
profile fitting analysis. The resulting fits and residuals, shown in Figs. 1g
and h, seem to be significantly worse than the ones given in Figs. 1e and f,
showing that the presence of an ``intermediate'' component is not required
by the data.
components, for
which we fixed the redshifts to the values obtained in the blue spectrum
profile fitting analysis. The resulting fits and residuals, shown in Figs. 1g
and h, seem to be significantly worse than the ones given in Figs. 1e and f,
showing that the presence of an ``intermediate'' component is not required
by the data.