Instrument web page |
OHP web page
SOPHIE : a stabilized instrument
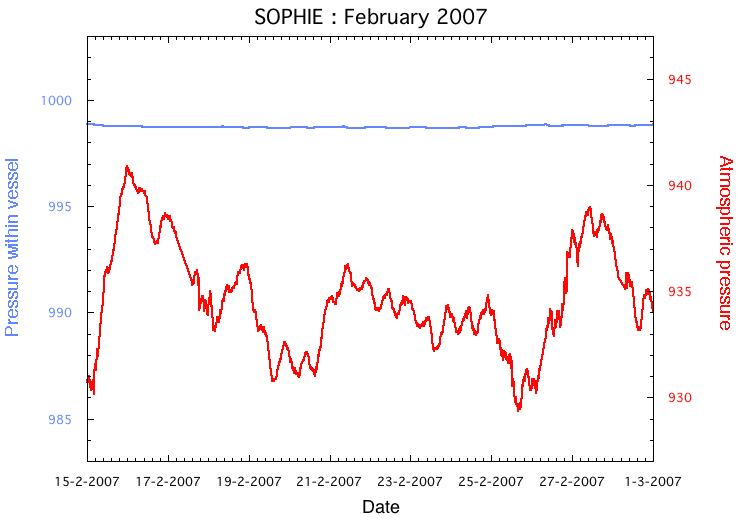
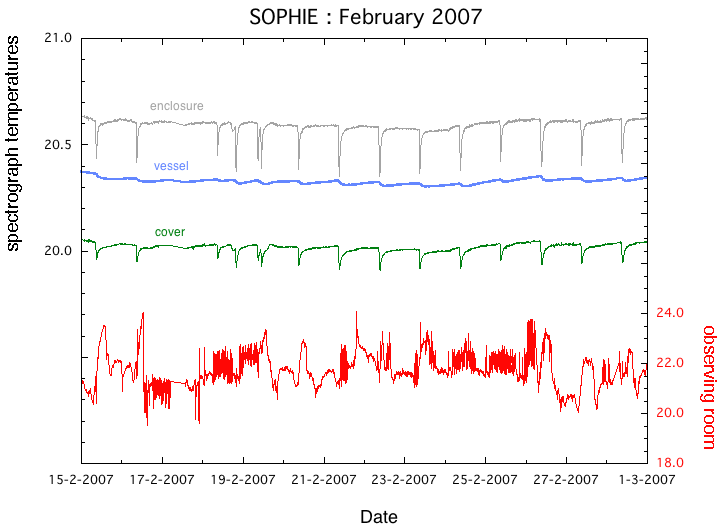
We illustrate here measurements of the pressure and temperature
for some of the probes around the SOPHIE spectrograph, over the
interval 15 February through 1 March 2007. The first plot illustrates
the pressure within the sealed
constant-volume vessel containing the dispersive elements
(blue curve, stable to within ±0.047 mb
std.dev.),
compared to the atmospheric pressure (red curve).

The second plot shows the following temperatures :
inside the sealed vessel (blue curve, stable to
within ±0.012° std.dev.),
in the observing room (red curve),
within the general spectrograph enclosure (grey curve)
and under the spectrograph cover (green curve). The
regularly spaced dips in the latter two curves
are due to a small thermal shock during cryostat re-filling,
which normally takes place every 24 hours, in the morning.
A small residual effect is seen in the blue curve.

updated: 22.03.07
|

